What Are Your Lateral Reclosers Telling You About Your System?
Back to Top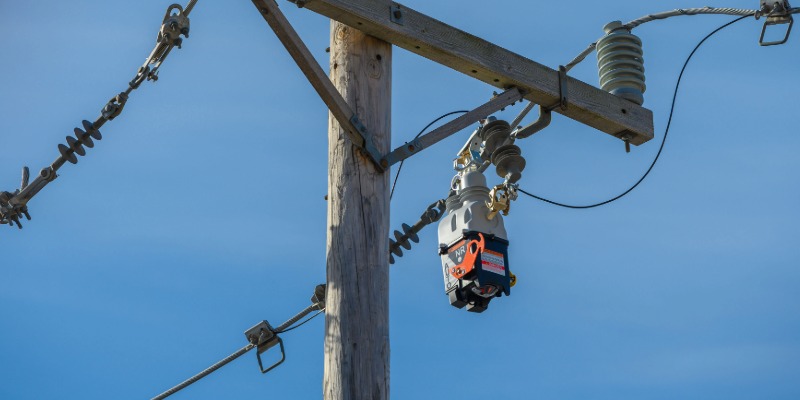
For over a century, utilities have depended on analog devices for overcurrent protection on the distribution system. On overhead laterals, single-phase reclosers are widely used to help improve power reliability.
A major benefit of single-phase reclosers is their ability to restore power after a temporary fault, but most utilities still rely on hydraulic reclosers, which don't provide data like fault magnitude or operations history. The missing information prevents a clear evaluation of the recloser’s performance or what its impact is on costs.
Utilities have modernized with smart metering and outage management systems to gain approximate grid visibility, but device-level data can provide more actionable insights.
Modern electronic reclosers do more than improve protection performance. They also provide valuable data that can help utilities enhance system reliability, visibility, and decision-making as they transition away from hydraulic reclosers.
The Value of Basic Visibility
Data logs and event history can serve as practical tools for validating the application of protection devices on the distribution system.
Device Operation
At the most basic level, utilities need to know the history and frequency of a device’s operations to assess its effectiveness. A long-standing rule of thumb in the industry is that 70-80% of faults on overhead distribution systems are a result of a temporary cause. Device operation logging enables utilities to evaluate whether that is true. This information can also tell the utility whether they have applied the recloser effectively. If, after years in service, the logs show that no temporary faults have been restored, it might be time to move that recloser to a different location on the system.
Protection Coordination
While operation history answers the question “Did the device operate?”, basic event logs help answer another critical question: “Should it have operated?”. Data from modern reclosers help utility engineers maintain coordination with the system throughout a device’s deployment.
Utilities deploy hydraulic reclosers with their fast and slow curves to implement a fuse-saving strategy. They place the recloser upstream of a fuse to prevent the fuse from operating on temporary faults, thereby saving costly truck rolls. But systems change over time— fault currents rise, fuse sizes change, and the recloser’s oil degrades.
When utilities replace their hydraulic reclosers with electronic reclosers and use the same fuse-saving scheme, the newly available device data often show that the scheme was no longer coordinated. This means the recloser and fuse were operating on temporary faults, resulting in nuisance momentary outages upstream of the fuse and avoidable sustained outages downstream of the fuse. An electronic recloser’s data provides the insights, and its programming flexibility allows for quick adjustment to restore proper coordination and improve customer reliability.
Progressing to Advanced Analytics
Recloser data are effective for evaluating the device's performance, but can do much more when you feed that information into larger systems.
Comparing System Models to Reality
Utilities tend to run the gamut with their system models; some trust them entirely, some not at all, but most fall somewhere in the middle. These models make assumptions about the system, and engineers rely on those assumptions for successful operation. Basic device operation data can be used to verify or modify these models, bringing them closer to reality.
Verifying Available Fault Current
Available fault current is an important parameter for protection coordination and is often derived from a system model. Modern electronic reclosers can log fault magnitudes and durations, and that data can be leveraged to adjust the model. For example, changes in fault current can indicate that it is time to re-verify the system’s coordination. If recurring faults fall outside the model's range, engineers can define a more accurate range to provide a more realistic model for the future.
Identifying Changing Load Patterns
Device statistics and system analytics can provide system planners with valuable information, even on blue sky days. These data sets may include total fault events, average loads by hour, day, month, or year, and peak daily demand.
For planning teams, that information can be useful beyond fault analysis. As load demands shift, utilities can evaluate system changes or targeted resilience upgrades before moving to larger capital investments.
The Role of Data Portability
Device data can provide many benefits, but data accessibility determines the usefulness of any systemwide analysis. If collecting the data is time-prohibitive, or the format is too complex, the data may not be leveraged.
Open or common data formats make retrieval, storage, analysis, and sharing easier.
- Event data in CSV files can be opened, analyzed, and filtered automatically in tools such as Excel.
- COMTRADE waveform files can be used with many waveform analysis tools for immediate addition to outage and event reports.
- JSON settings files are human-readable and can make it easier to automate and analyze device configuration information across an always-evolving system.
When evaluating a new device from a data operations perspective, assess the ease of data retrieval not only from one device but from hundreds of devices or more to account for scalability.
In a future state, repeatable data analysis requires practical data retrieval and storage. Starting by building a data repository is helpful even if engineering teams are not actively analyzing yet.
Begin with the Questions You Cannot Answer Today
The future of lateral visibility will come from the data provided by protection devices themselves. That does not mean every utility needs to jump immediately to the most advanced analytics. A more realistic path may look like this:
- Validate the basics.
Are the devices operating? How often? Are they providing the benefits they claim to provide? - Use event data to assess coordination.
Is the device operating when it should? Does it operate when it shouldn’t? Are any other devices, upstream or downstream, also operating during the same event? - Analyze the broader system.
Can fault current tell you if the system model is accurate? Can waveforms indicate whether fuses are operating as designed by the manufacturer, or whether the wrong fuse link size was installed by accident? - Standardize file storage and settings records.
Can you automate the tracking of event history and device settings across the fleet? - Apply deeper analysis where it matters most.
Are there recurring events, unexpected operations, miscoordination concerns, or anomalous waveforms that require review or more detailed analysis?
When lateral visibility is limited or unavailable, standing up basic capabilities should require minimal field work and system integration. TripSaver® FXR Reclosers mimic the form and function of fuses, and their electronic TCC curve libraries allow for easy slotting into existing coordination schemes.
For utilities with larger fleets and engineering teams, advanced analytics require accessible records, clear history, and portable data formats. TripSaver FXR reclosers provide event logs in CSV format, settings files in human-readable JSON format, and waveform captures in COMTRADE format.
TripSaver FXR reclosers also utilize field-swappable Data Modules for plug-and-go retrieval without taking the device out of service. This design approach reduces the time and complexity for field crews to collect data.
The first step is not necessarily doing more with data. It is making sure the data is available, usable, and connected to the current decisions utilities need to make. It can also help to start with the end in mind. Considering the kinds of analyses you want to be doing 10 years from now helps ensure the devices you deploy today will not limit what you can achieve tomorrow.
Explore TripSaver FXR reclosers to learn more about how you can achieve enhanced lateral protection and grid visibility from one device.
Publication Date
October 30, 2026