Moving Beyond Average Reliability Metrics
Back to Top
Reliability is a key aspect of utility performance. It matters to the utilities, regulators, and the utilities’ customers. However, the most used reliability metrics, such as the System Average Interruption Frequency Index (SAIFI), the System Average Interruption Duration Index (SAIDI), and the Momentary Average Interruption Frequency Index (MAIFI), don’t tell the whole story.
In recent years, key changes have occurred in how electricity is both generated and used. Simultaneously, consumers and businesses have become more reliant on electricity for digital services and transportation, and they have come to expect uninterrupted service. The COVID-19 pandemic has especially brought this to light.
As more people are sheltering, working from home, and doing at-home schooling, any interruption in power can stretch beyond just affecting homeowners’ needs; it can also affect business and educational performance as well.
As such, average systemwide performance measures can mask significant differences in reliability and create a disconnect with what utility customers are experiencing. Investments and incentives based solely on broad system measures may encourage utilities to focus on making good performance better instead of addressing the needs of worst-served customers at the grid edge.
While electricity users place high value on system resilience during storms, average reliability metrics often exclude such “major event days.” Ironically, this is when homes—and businesses in today’s more common work-from-home environment—can be most affected by outages.
The inclusion of more customer-centric metrics as part of a suite of reporting can provide a more complete picture that includes reliability experienced by worst-served customers. This can help with more targeted investment and, in turn, improve customer satisfaction.
Customer-centric metrics can be used in conjunction with traditional metrics to deliver a more complete picture of system performance. Some examples in use today include:
CEMI: Customers Experiencing Multiple Interruptions
CEMM: Customers Experiencing Multiple Momentaries
CELID: Customers Experiencing Long Interruption Duration
Another under-used metric that should get more focus is Customers Experiencing Multiple Sustained and Momentary Interruptions (CEMSMI). This metric covers the number of customers experiencing more than a certain number of interruptions a year, including both momentaries and sustained outages.
The chart below shows S&C’s interpretation of the key reliability metrics, the present relative level of utility use of the metrics, and our view of how this should change so there’s a greater focus on customers.
S&C Interpretation of Key Reliability Metrics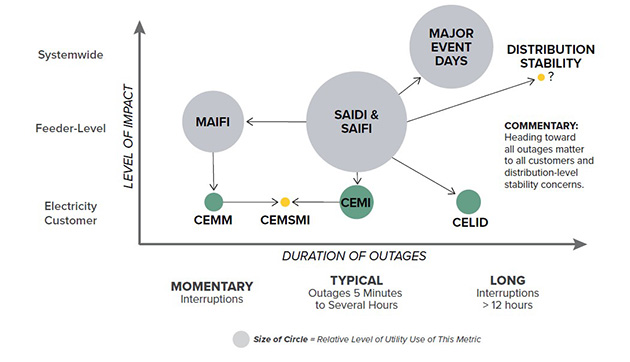
With a future expected to have much higher levels of intermittent renewable energy sources and electrification of the transportation system, distribution-level stability metrics are likely to be a new area of focus.
For further information, please see the recently published S&C white paper, "Moving Beyond Average Reliability Metrics." I’d also be interested in learning your thoughts on this subject in the Comments section below.